

When your operations team and your analytics team bring different sales figures for the same day to the same meeting, the discussion tends to turn to whose figure is right. A multi-brand QSR operator with two thousand sites might run three POS systems, two loyalty platforms, four delivery integrations, and an inventory layer built in-house. In that kind of network, analytics dashboards often get checked against other sources before anyone acts on them, and operations keeps its own dashboards built from its own extracts.
The usual response targets the dashboards: a new BI tool, a semantic layer, or a working group to agree definitions. Those can help, agreed definitions especially, but they act after the steps where data is collected, assigned to a day, and matched across sources. In many networks the disagreement is created at that earlier stage. This post works backwards from one disputed number to those causes, then forwards to the pipeline and the operating disciplines that reduce them. Our earlier post Telemetry Is Becoming the Business made the cross-industry case that operational telemetry now has to be engineered as a data product, and a network’s sales record is a clear case.
The competing dashboards
Take one store, the fictional store 0412, on a Saturday. It takes delivery through one aggregator, which injects orders into its POS. At about 11pm on Saturday its broadband failed. The cellular failover carried only card payments and order injection, so the back-office upload stopped until Sunday morning. The operations dashboard shows net sales of $18,420. That’s the figure in the POS end-of-day report the store manager signs off. The report arrived on Sunday morning when the upload resumed. The analytics dashboard, built from transaction feeds loaded overnight, shows $19,255.
Rather than argue over whose figure is right, the two teams can build a reconciliation bridge, which walks from one figure to the other, one cause at a time. The figures are illustrative, but in our experience the line items are the kind that turn up when this is done on a real network.
| Step | Amount | Running total |
|---|---|---|
| Operations dashboard (POS end-of-day report) | $18,420 | |
| Trading-day boundary: the POS counts sales up to its 4am cutoff as the previous day’s; the warehouse uses calendar date | −$1,160 | $17,260 |
| Transactions recorded before midnight while the link was down, which missed the overnight load | −$640 | $16,620 |
| Aggregator-feed copies of orders the POS also recorded (excluding tax and fees) | +$2,175 | $18,795 |
| Tax and customer-paid delivery and service fees on those aggregator copies, counted as net sales | +$460 | $19,255 |
| Analytics dashboard | $19,255 |
In the warehouse, Saturday night’s midnight-to-4am window drops out of Saturday and Friday night’s comes in, which nets to the first line. Sales after midnight during the outage were also late; the bridge counts them under the trading-day line and leaves them out of the late-transactions line. The late-transactions line exists because the analytics model loads each day once and doesn’t go back for late arrivals.
Two lines are rules that differ between teams, one is an arrival gap, and one is a duplicate the analytics model doesn’t look for. At this store the fee line disappears with the duplicates. The rule still matters for every aggregator order the POS never sees. Tax is not part of net sales, and customer-paid delivery and service fees on marketplace orders usually belong to the aggregator. Resolve all four, using this POS’s definition of net, and store 0412 comes to $18,420, the POS figure, because every sale here went through the POS. Where injection fails during an outage and orders are taken on the aggregator’s tablet instead, those orders exist only in the aggregator feed. Orders a POS never sees are added on top and reconciled at settlement.
There’s often a fifth item that never makes the bridge, because it has to be solved before any comparison can be made. The store is 0412 in the POS, carries a different code in the inventory system, and has a third identifier in the delivery platform’s merchant portal. Before anyone can compare a figure, someone has to know which records belong to the same store.
How QSR data estates fragment
In our experience, networks like this grow one system at a time. Each system arrives to solve a specific problem and brings its own clock, store identifiers, and definition of a sale. An acquisition brings a second POS. A brand launched in another market brings a third. Delivery marketplaces are often integrated one at a time, some injecting orders into the POS and some not, and the choice can differ by brand, by market, or by aggregator. The loyalty platform from Part 1 adds its own view of the same transactions. Unifying data that sat in separate point-of-sale, loyalty, marketing, supply chain, and franchisee reporting silos on a single data engineering platform was a core part of Sakura Sky’s work with Craveable Brands.
Franchise networks add another layer. Some systems are chosen by franchisees, and the franchisor may receive only what the franchise agreement provides for, sometimes a daily sales report rather than transaction detail. The royalty base is usually a contractual definition of gross sales, so any published definition of net also has to map back to it.
Each team then builds the extracts it needs for its own questions. Operations takes the POS end-of-day reports because they come from the same close the manager signs off and counts the tills against. Analytics builds from the transaction-level feeds because it needs baskets, dayparts, and channels. Finance usually books from the daily sales journal and closes against card settlement, aggregator payouts, and bank deposits. All three are reasonable choices, and all three produce numbers that differ for reasons like those in the bridge.
When the numbers disagree, the fix usually lands in the dashboard layer, as a filter that excludes one aggregator’s feed, a calculated field that subtracts tax, or a date shift for after-midnight trading. Each fix lives in one dashboard or one team’s semantic model, so dashboards built elsewhere from the same tables don’t have it, and the copies accumulate.
The dashboard layer is also a poor place for some of these rules. It can’t recover transactions that weren’t loaded. Matching duplicate orders and assigning trading days can be done there, but every model has to repeat the work, and the copies drift apart. A shared semantic layer is a reasonable place to expose the definition of net, but matching orders and recovering late data have to happen upstream of it.
A medallion pipeline for a multi-site network
What matters most in the architecture is where each decision is made, whichever products implement it. Much of Sakura Sky’s lakehouse work uses the medallion pattern for this. Bronze holds raw data as received, silver holds cleaned, deduplicated, and conformed records, and gold holds the aggregated, business-ready tables that dashboards read (Databricks, 2026; Google Cloud, n.d.d). Figure 1 shows the layers.
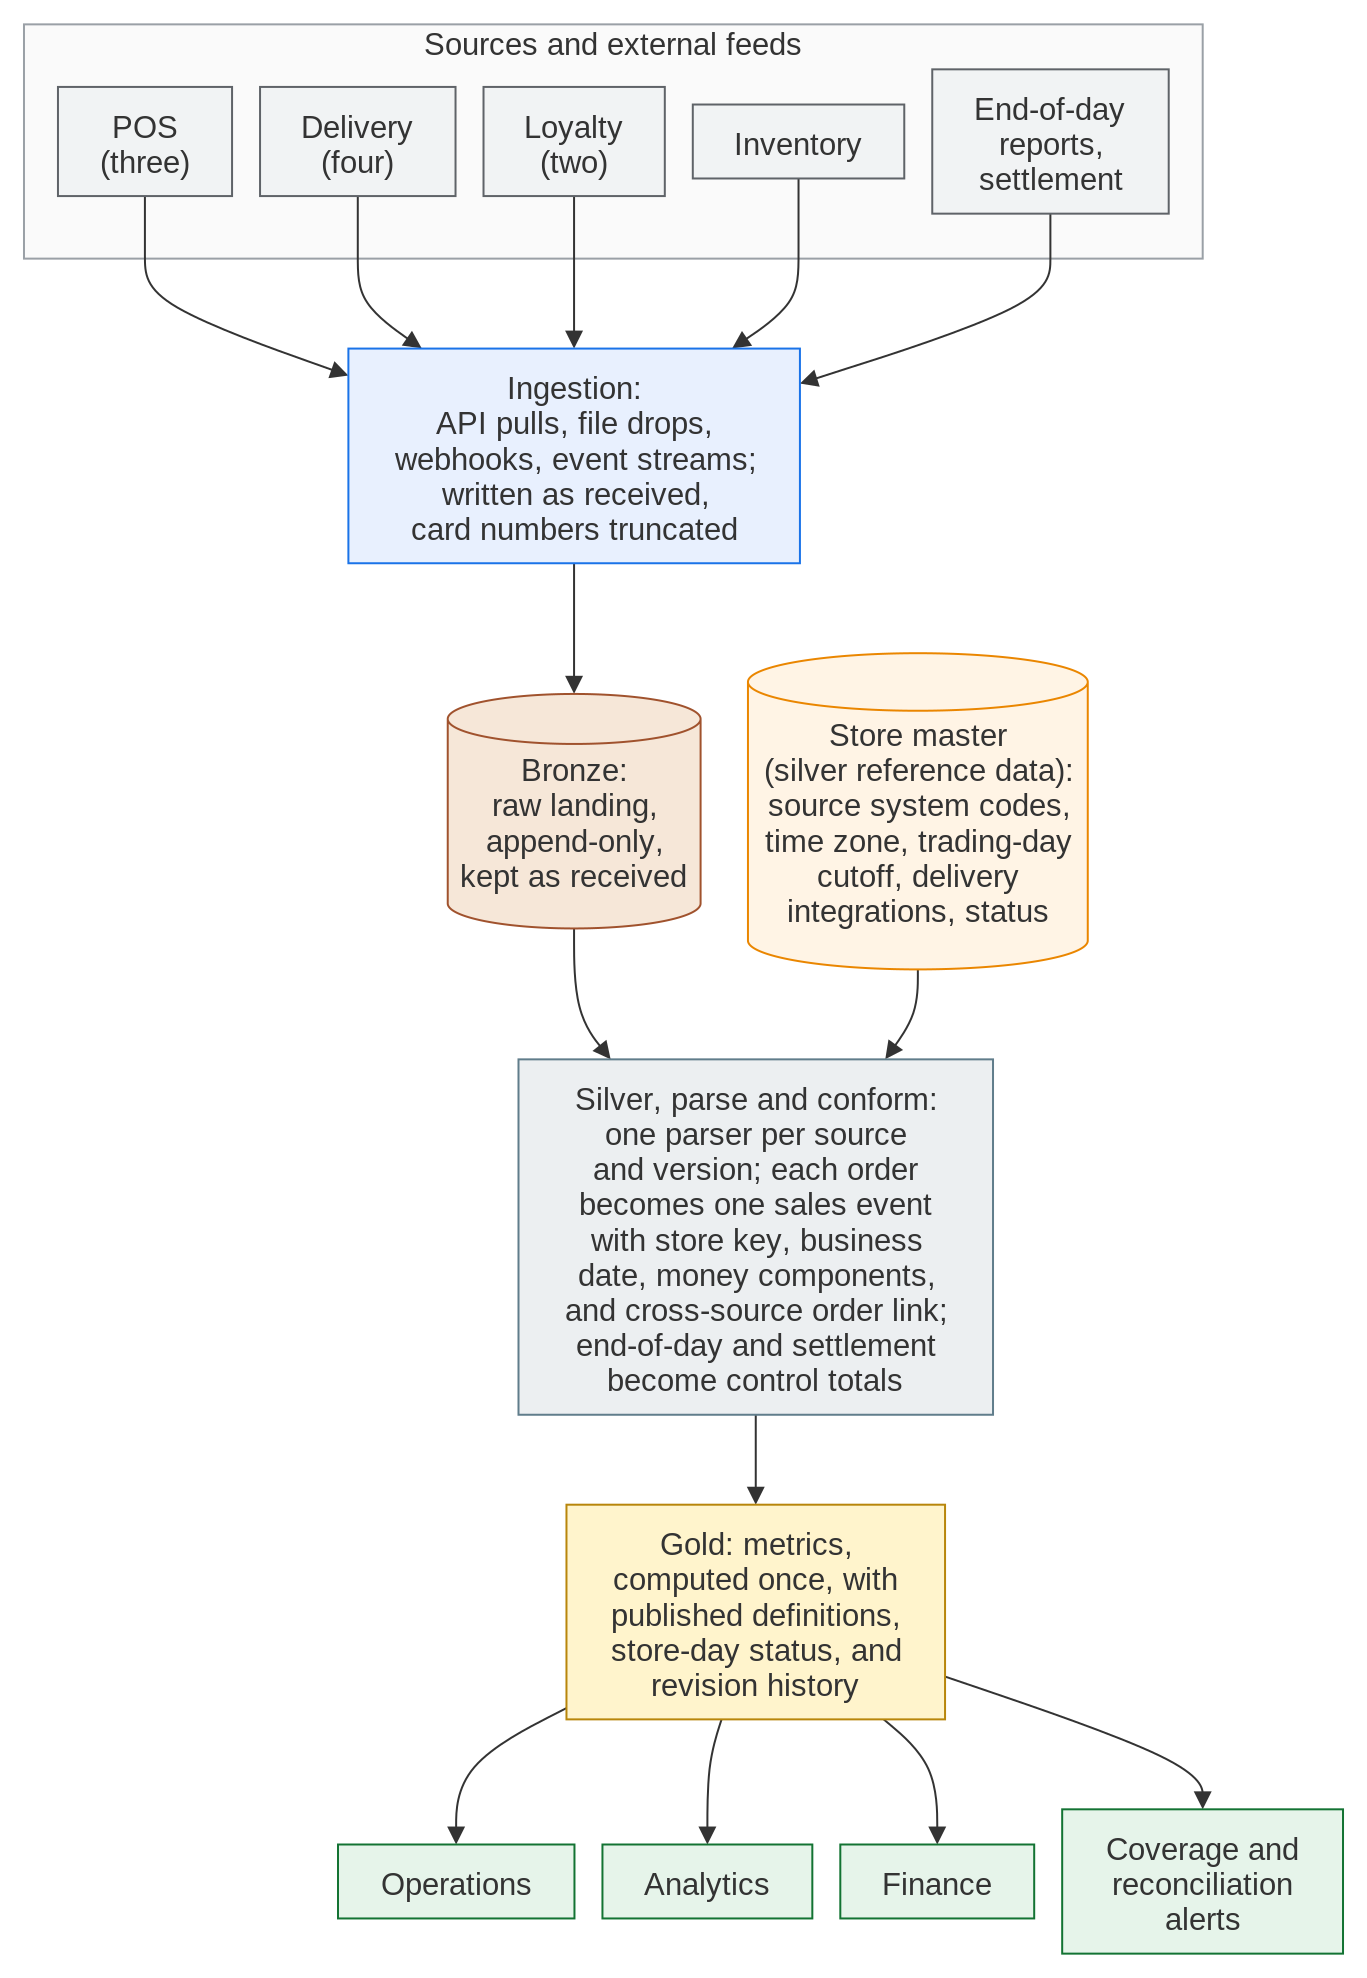
Ingestion jobs (API pulls from POS and aggregator platforms, file drops, webhooks, and event streams) write each source’s data into the bronze layer as received. Bronze is append-only apart from retention and erasure deletes. It also holds the POS end-of-day reports and payment settlement files, which silver later parses into control totals. The one exception to “as received” is cardholder data. Incoming data is checked for full card numbers or track data at ingestion. Card numbers are truncated and track data is removed before landing, and each hit is logged (without the data) and raised with the source system to fix. The ingestion step that does this, and any drop zone or queue the raw files pass through first, handles card data, so in our designs it’s treated as inside PCI DSS scope and kept small and locked down.
Bronze also needs retention and erasure rules for personal data, such as loyalty identifiers and the customer names and addresses in delivery orders. Erasure has to reach every layer. In silver and gold it only fully takes effect once BigQuery’s time travel window has passed (Google Cloud, n.d.b) or old Iceberg snapshots have been expired, and in bronze once any soft-deleted or versioned objects have aged out.
That raw history is what lets the pipeline reprocess a store-day when a rule changes or a late batch arrives (Databricks, 2026; Google Cloud, n.d.d), without asking the POS vendor to resend anything. Parsing happens after landing, with one parser per source system and version, so a change in one vendor’s export format is contained in one place.
Silver is where most of the bridge items get resolved, once. Databricks lists deduplication and the resolution of out-of-order and late-arriving data among the jobs of this layer (Databricks, 2026). That’s where the duplicate line belongs, though matching one order across two systems is closer to entity resolution than to removing repeated rows. The late-transactions line is closed by reprocessing the day from bronze, with gold’s store-day status showing it as provisional until then.
The trading day is a conforming rule applied in silver, using the store master (silver reference data). The store master maps each source system’s code to one store key and records the store’s time zone, trading-day cutoff, delivery integrations, and status. It keeps each attribute with the dates it applied, so reprocessing an old day uses the cutoff and codes that applied then.
Each order becomes one sales event carrying the store key, the event time, and a business date (the trading day it belongs to). Its line items are kept alongside, and refunds and post-tender voids are recorded as their own events. Money is kept as components (gross, discounts, brand-funded and aggregator-funded promotions, tax and who remits it, customer-paid delivery and service fees, aggregator commission, and tips), so net sales becomes a published definition built from those components. Networks that trade in more than one currency also need a stated conversion policy for any network-wide figure.
Orders that arrive from more than one source carry a cross-source link, typically the aggregator’s order ID where the POS integration records it. Where it doesn’t, a fallback match on store, time, and amount pairs orders one-to-one within a tolerance, since the two copies rarely carry identical amounts (modifiers, promotions, and tax are often recorded differently). Ambiguous candidates are left unmatched. Until it’s matched, the aggregator copy of an order from an injecting integration is held out of net sales, so a missed match understates delivery rather than double-counting it. Once the store-day reconciles to its end-of-day report, the POS side is treated as complete. Any aggregator orders still unmatched are then checked against the day’s POS orders from any channel, because staff often re-key tablet orders by hand when injection fails. Those still unmatched after a holding period are released into net as aggregator-only sales and flagged. That changes the store-day’s net but not its reconciled status, which covers POS-sourced orders only, and they’re tracked against settlement rather than counted as corrections. A rising rate of unmatched orders is treated as an integration fault to fix at source, usually by getting the POS integration to record the aggregator’s order ID.
The merged order keeps the POS business date, so the two copies can’t land on different trading days near the cutoff. It also keeps both sets of money components, the POS’s for reconciling to the end-of-day report and the aggregator’s for settlement. Net sales uses the POS’s components.
Where the POS records its own business date, the pipeline usually adopts it, because that’s the day the end-of-day report covers. Listing 1 is for the sources that don’t, such as aggregator feeds, and assigns each event to the store’s trading day from its time and the store’s configured cutoff. Where managers run the POS close by hand, the cutoff approximates it. Aggregator feeds can carry several timestamps per order, so the rule uses one agreed timestamp, usually when the order was accepted.
Python
from dataclasses import dataclass
from datetime import date, datetime, time, timedelta
from zoneinfo import ZoneInfo


@dataclass(frozen=True)
class Store:
    store_key: str     # one key across POS, delivery, loyalty, and inventory
    tz: str            # IANA zone name, e.g. "America/Chicago"
    day_cutoff: time   # trading day rolls over here, e.g. 04:00; keep it
                       # clear of the hour that repeats when clocks go back
    # zone and cutoff are the store's attributes as of the event's date

    def __post_init__(self) -> None:
        ZoneInfo(self.tz)  # fail fast on an unknown zone name
        if self.day_cutoff.tzinfo is not None:
            raise ValueError("day_cutoff must be naive local time")


def business_date(store: Store, event_time: datetime) -> date:
    """The trading day an event belongs to, in the store's own terms."""
    if event_time.utcoffset() is None:
        raise ValueError("event_time must be timezone-aware")
    local = event_time.astimezone(ZoneInfo(store.tz))
    if local.time() < store.day_cutoff:
        return local.date() - timedelta(days=1)
    return local.date()
Rust
use chrono::{DateTime, Days, NaiveDate, NaiveTime, Utc};
use chrono_tz::Tz;

#[derive(Debug, Clone)]
pub struct Store {
    pub store_key: String,     // one key across POS, delivery, loyalty, and inventory
    pub tz: Tz,                // IANA zone, e.g. chrono_tz::America::Chicago
    pub day_cutoff: NaiveTime, // trading day rolls over here, e.g. 04:00; keep it
                               // clear of the hour that repeats when clocks go back
    // zone and cutoff are the store's attributes as of the event's date
}

/// The trading day an event belongs to, in the store's own terms.
/// Taking `DateTime<Utc>` means a time without a zone can't be passed in.
pub fn business_date(store: &Store, event_utc: DateTime<Utc>) -> NaiveDate {
    let local = event_utc.with_timezone(&store.tz);
    if local.time() < store.day_cutoff {
        local.date_naive() - Days::new(1)
    } else {
        local.date_naive()
    }
}
Listing 1. Assigning an event to the store's trading day, using the store's IANA time zone and cutoff.
The store carries an IANA time zone name instead of a fixed UTC offset, because offsets and daylight-saving rules change by government decision. The IANA Time Zone Database is updated to track those changes (IANA, n.d.). Its 2026 releases record British Columbia, Alberta, the Northwest Territories, and Manitoba moving to permanent UTC offsets (IANA, 2026), so a service on older rules would put most stores in those regions an hour out each winter, starting in November 2026.
The name only helps if the database behind it is current. Python’s zoneinfo reads the operating system’s copy or the tzdata package (Python Software Foundation, 2026), so updating those is the usual route. ZoneInfo also returns cached zone objects, so a long-running process can keep serving the old rules until it restarts or clears the cache. The chrono-tz crate builds the database into the binary at compile time (chrono-tz contributors, 2025), so a change normally arrives with a crate release that includes it, followed by a rebuild. Its latest release at the time of writing, 0.10.4 from July 2025, predates all four changes. A Rust service for stores in those regions needs either a chrono-tz release with current rules, once one ships, or a time zone source that reads the system’s database at runtime. Listing 1 uses chrono-tz to keep the example short. Rules applied in SQL or in Spark typically use that engine’s own copy of the database, which needs the same attention.
Daylight saving also makes some trading days shorter or longer than usual, which is worth flagging on hourly and same-day-last-year comparisons. Some POS exports record only local wall-clock time with no offset. The parser then converts using the store’s zone, and both the skipped hour when clocks go forward and the repeated hour when they go back need an explicit rule. Python’s zoneinfo, for example, treats a repeated time as its first occurrence (fold=0) unless told otherwise (Python Software Foundation, 2026).
Gold metrics are then computed once, upstream of every dashboard, with their definitions published alongside them. Operations, analytics, and finance can still build different views, at different grains and for different questions, but they read the same net sales for store 0412 on Saturday.
Google Cloud’s medallion explainer puts bronze in Cloud Storage and silver and gold in BigQuery, with the transformations written in SQL (for example with Dataform) or in Apache Spark (Google Cloud, n.d.d).
Networks that want to stay on open formats can keep silver and gold as Apache Iceberg tables (Apache Iceberg, n.d.a). BigQuery’s Iceberg managed tables (formerly BigLake tables for Apache Iceberg in BigQuery) store the data in buckets the customer owns. Writes go through BigQuery, including from Spark and Dataflow via its Storage Write API. Open-source engines such as Spark can read the tables, though Google warns that modifying the data files outside BigQuery can cause query failure or data loss (Google Cloud, n.d.a). Late store-days are reprocessed through BigQuery’s DML (Google Cloud, n.d.a). Where Spark manages its own Iceberg tables through its own catalog, MERGE INTO does the same job (Apache Iceberg, n.d.d).
Neither platform’s time travel is a long-term record. BigQuery’s window is configurable from two to seven days, with seven by default (Google Cloud, n.d.b). Iceberg snapshots last until they’re expired, and expiring them regularly is recommended, after which they’re no longer available for time travel (Apache Iceberg, n.d.c). A month-end state can be kept longer with a BigQuery table snapshot of a standard table, taken at month-end (Google Cloud, n.d.c), or with an Iceberg tag where Spark or another engine manages the Iceberg catalog (Apache Iceberg, n.d.b). BigQuery’s Iceberg managed tables don’t support table snapshots (Google Cloud, n.d.a), so on those the month-end state is written out explicitly.
Finance and franchisees need to know what a store-day showed when a month-end report or royalty statement was produced. A pinned copy doesn’t record why a figure changed, so revision history is kept explicitly, as a gold table of store-day versions with the reason for each change.
The same layering works on Databricks (Databricks, 2026) or a self-managed Iceberg catalog, and the platform choice is a question for an initial cloud assessment. Part 3 of this series will look at networks whose data already spans more than one cloud.
Operating disciplines around the pipeline
An architecture like Figure 1 can still produce numbers nobody trusts if the pipeline treats each day as finished as soon as a load has run. The Dataflow Model paper treats this as a starting assumption: for data that arrives continuously and out of order, a system can’t know whether it has seen everything, only that new data will arrive and earlier data may be retracted (Akidau et al., 2015). A two-thousand-site network behaves like that kind of source. On a typical night in a network this size, some stores are likely to be offline and some POS terminals likely to forward late.
The discipline that follows is to make each store-day’s state visible. Listing 2 is a simple version. A store-day is open until its trading day ends. It’s provisional until the pipeline’s net for POS-sourced orders agrees with the store’s end-of-day report, and reconciled once it does. That report covers only what went through the POS. The comparison uses each POS’s own definition of net, rebuilt from the stored components, so a definitional difference doesn’t look like missing data.
Python
from enum import Enum


class DayStatus(Enum):
    OPEN = "open"                # trading day not yet ended
    PROVISIONAL = "provisional"  # ended, not yet reconciled
    RECONCILED = "reconciled"    # agrees with the store's end-of-day report


def store_day_status(
    *,
    trading_day_ended: bool,
    pipeline_pos_net_minor: int,     # pipeline net for POS-sourced orders, in minor units
    pos_eod_net_minor: int | None,   # None until the end-of-day report lands
    tolerance_minor: int,            # set per POS; line rounding and tax-inclusive
                                     # pricing can differ
) -> DayStatus:
    if tolerance_minor < 0:
        raise ValueError("tolerance_minor must not be negative")
    if not trading_day_ended:
        return DayStatus.OPEN
    if pos_eod_net_minor is None:
        return DayStatus.PROVISIONAL
    if abs(pipeline_pos_net_minor - pos_eod_net_minor) > tolerance_minor:
        return DayStatus.PROVISIONAL
    return DayStatus.RECONCILED
Rust
#[derive(Debug, Clone, Copy, PartialEq, Eq)]
pub enum DayStatus {
    Open,        // trading day not yet ended
    Provisional, // ended, not yet reconciled
    Reconciled,  // agrees with the store's end-of-day report
}

pub fn store_day_status(
    trading_day_ended: bool,
    pipeline_pos_net_minor: i64,    // pipeline net for POS-sourced orders, in minor units
    pos_eod_net_minor: Option<i64>, // None until the end-of-day report lands
    tolerance_minor: u64,           // set per POS; line rounding and tax-inclusive
                                    // pricing can differ
) -> DayStatus {
    if !trading_day_ended {
        return DayStatus::Open;
    }
    match pos_eod_net_minor {
        Some(eod) if pipeline_pos_net_minor.abs_diff(eod) <= tolerance_minor => {
            DayStatus::Reconciled
        }
        _ => DayStatus::Provisional,
    }
}
Listing 2. Store-day status: open, provisional, or reconciled against the store's own end-of-day report.
Orders that never pass through the POS, such as those from non-injecting aggregators, aren’t covered by this check; they’re reconciled against the aggregator’s own reports or settlement, usually later. A production version also records why a day is provisional (report missing or totals that don’t match) and how long it has been in that state, and compares transaction counts as well as net, since totals alone can hide offsetting errors.
Franchised stores that send only a daily sales report have nothing at transaction level to reconcile it against, so those store-days carry their own status. They’re checked against card settlement or aggregator data where the franchise agreement provides it, and against royalty submissions.
The status is recalculated whenever a store-day’s events change, so a reconciled day returns to provisional if a late batch moves its POS-sourced total. In the estates we work with, refunds are usually booked to the day they’re processed, matching the POS, so a reconciled day isn’t reopened by them.
A change to a provisional day is a revision, and a change to a day that had already reconciled is a correction. The revision history covers both. Neither is a restatement in the accounting sense.
Once finance has closed a period, a small correction is usually carried into the open period, and a correction to a day already covered by a royalty statement becomes an adjustment on the next one. Gold keeps the corrected store-day for operational analysis, and the revision history keeps the version that finance and the franchisee were given.
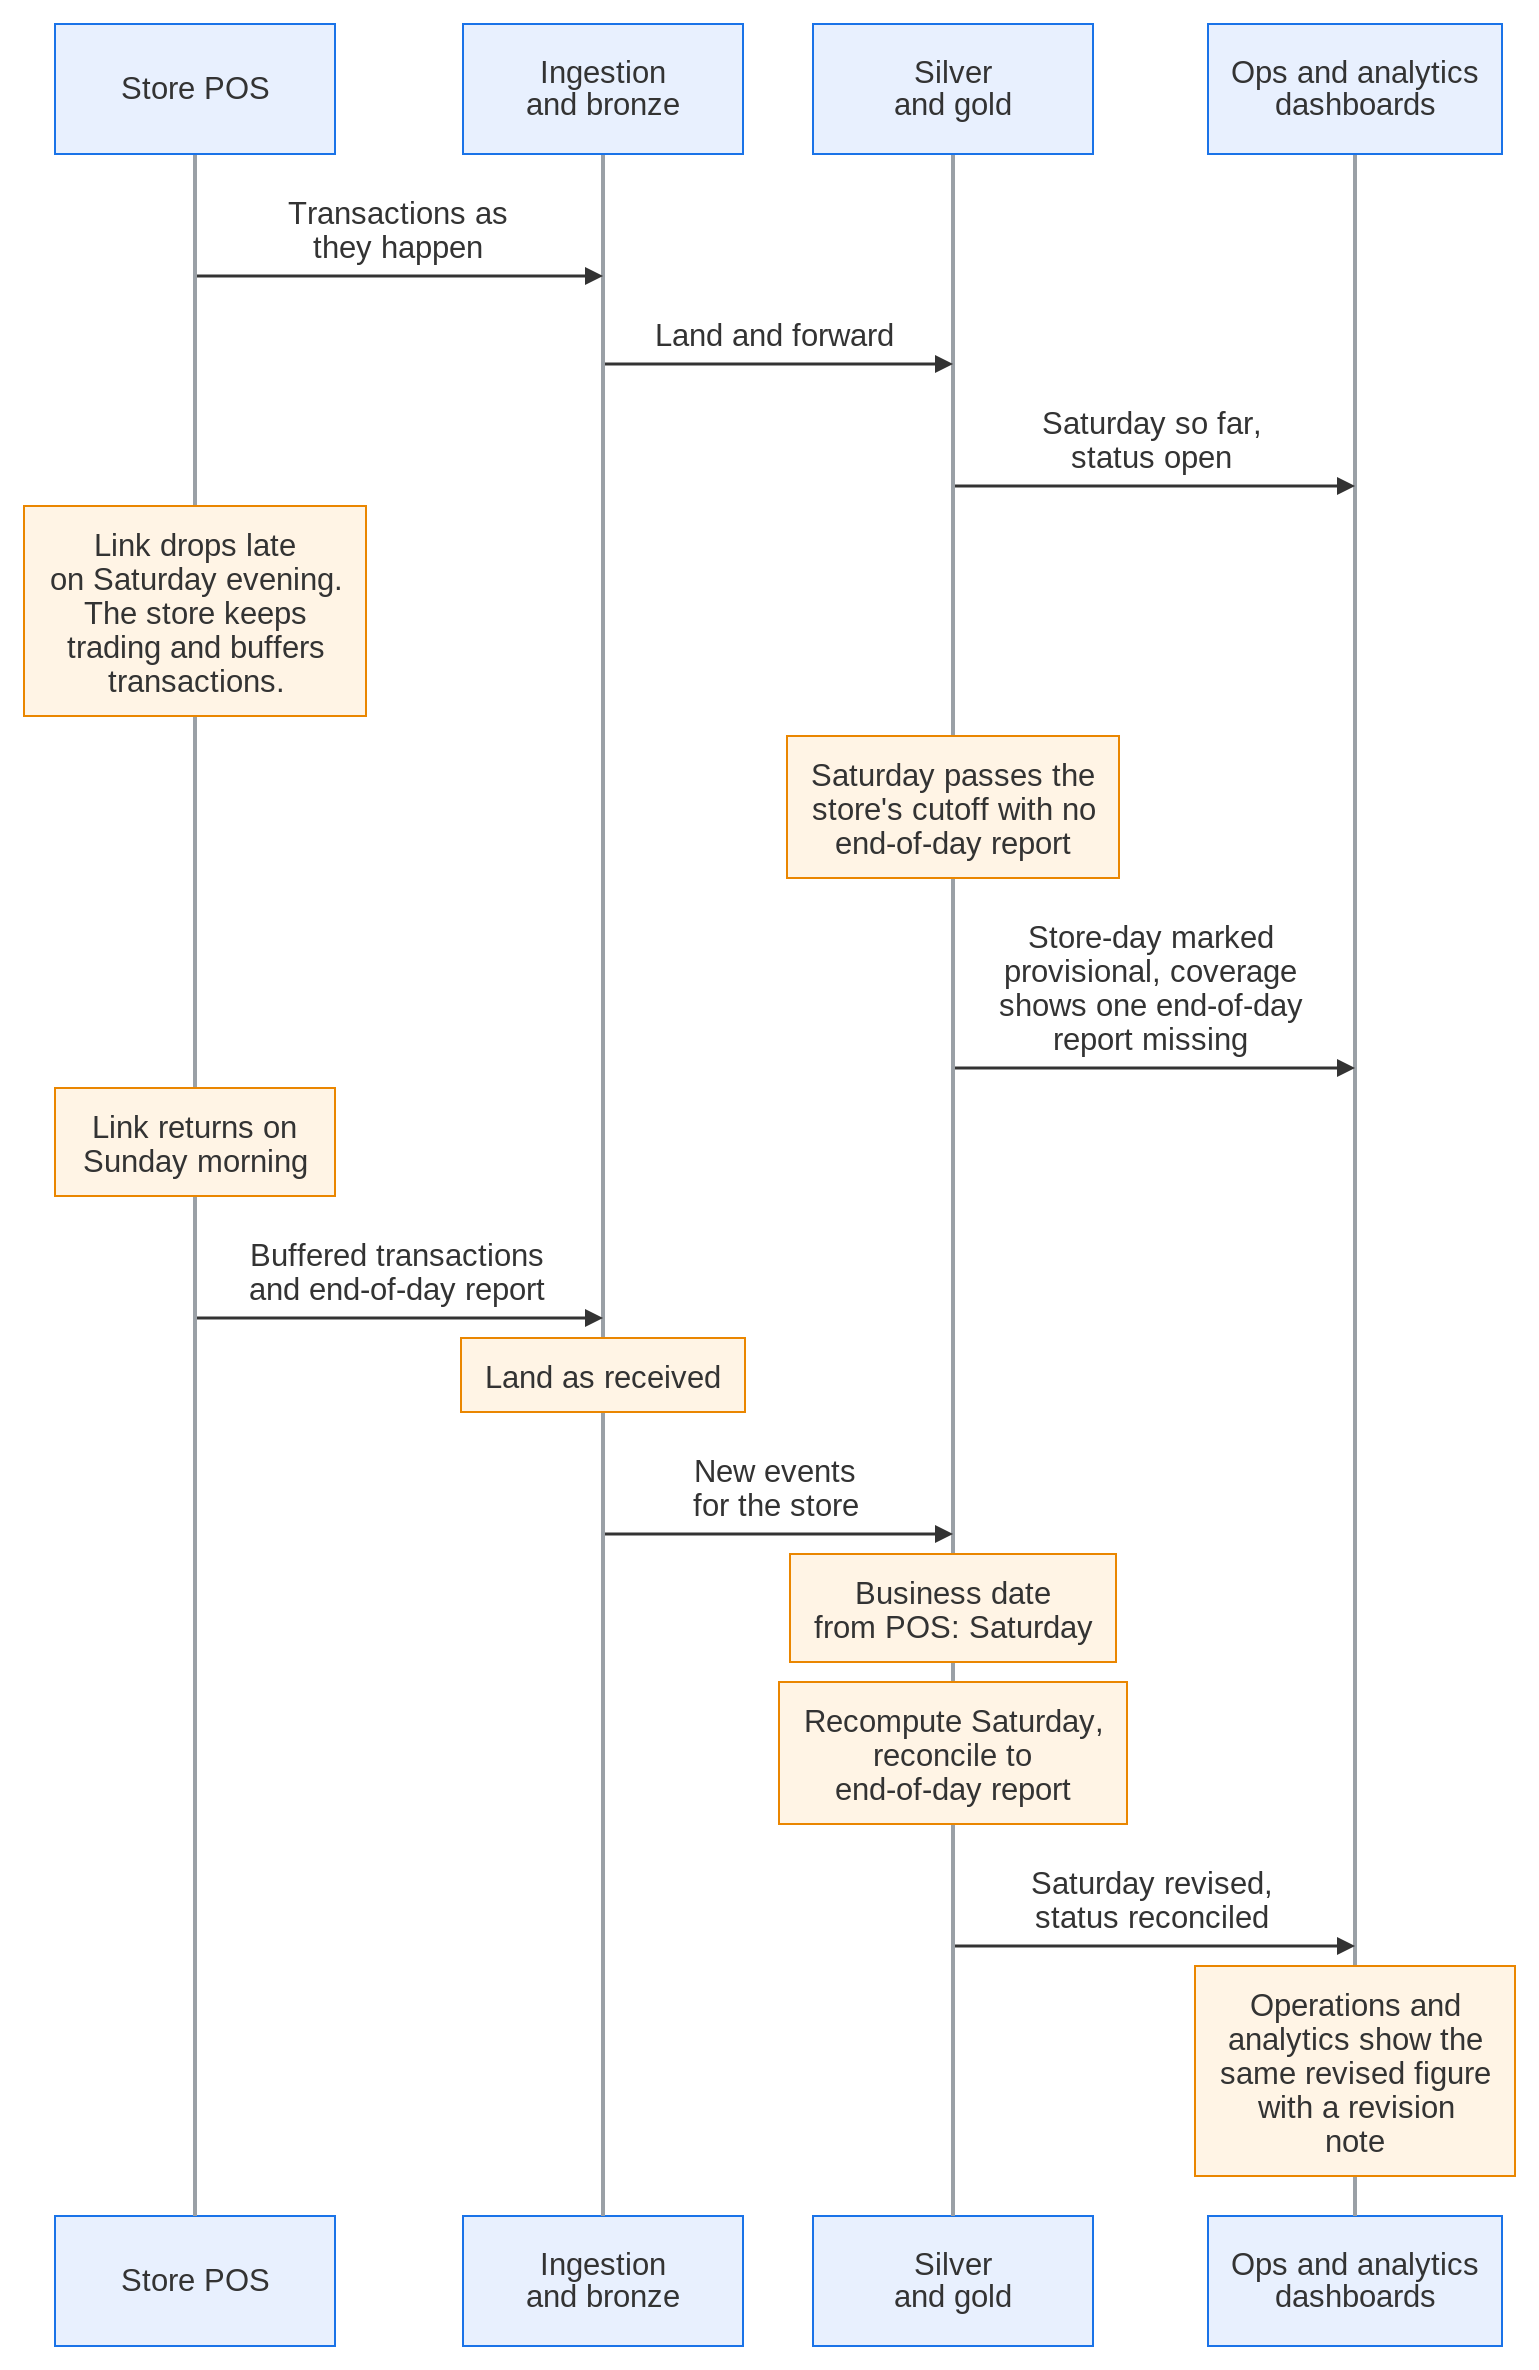
Figure 2 follows store 0412 through its lost link. Saturday shows as provisional, with its end-of-day report counted as missing in the coverage figure, until the buffered transactions and the report arrive on Sunday morning and the day reconciles. The revised figure then reaches both teams’ dashboards from the same table on their next refresh, with a note that the day was revised.
The status depends on a few other practices. Coverage is reported every day as store-days with an end-of-day report received against store-days expected to trade, which needs the store master to know about openings, closures, refits, and changes of trading hours. The store master itself has an owner, because a franchise transfer or a reopened site under a new code breaks joins without warning, and the first sign is often a dashboard that looks wrong weeks later.
Each parser has tests against sample files from its source system. POS and aggregator releases are also tracked; in our experience, a POS release rolled out store by store often shows up as a gradual drift in one brand’s numbers. Card processor settlement and aggregator payouts give a second reconciliation point independent of the stores, usually run later and at finance’s grain, while cash goes through deposit reconciliation.
What changes for operations and analytics
For operations, the most visible change is that the figure they already reconcile to becomes the control total the whole pipeline is held to. Their dashboards move onto the gold layer, and the end-of-day report keeps its standing because it’s the store’s own close. Analytics changes too, giving up calendar-date grouping and its own tax and fee handling for the shared conforming rules in silver and the published definition of net in gold.
Operations usually hears first about changes to trading hours, cutoffs, temporary closures, and refits. The pipeline now reads them from where operations records them, so a store that closes early for a refit doesn’t show as missing. For franchised sites, coverage alerts go to the franchisee through the field team, under the reporting terms of the franchise agreement.
The daily conversation changes shape too. A morning summary might read: 1,826 of 1,839 expected transaction-feed store-days reconciled to their POS end-of-day reports, and 13 provisional. Of 150 daily-report franchise stores, 148 have reported. Two previously reconciled days were corrected since yesterday and are reconciled again, and aggregator-only sales are still to reconcile at settlement.
Disagreements still happen, but they move to definitions that can be decided once: whether staff meals and manager comps count as sales, whether operational figures follow finance in keeping gift card loads out until redemption, how loyalty redemptions and aggregator-funded promotions reduce net, which price counts for marketplace orders, and whether a delivery fee on the brand’s own app counts as a sale. The decision is then applied in the pipeline, where every dashboard picks it up.
Sakura Sky’s Data & AI practice builds and runs pipelines like this for restaurant and retail networks, from POS and aggregator ingestion through to the store-day status that operations, analytics, and finance read.
References
Akidau, T., Bradshaw, R., Chambers, C., Chernyak, S., Fernández-Moctezuma, R.J., Lax, R., McVeety, S., Mills, D., Perry, F., Schmidt, E. and Whittle, S., 2015. The Dataflow Model: A Practical Approach to Balancing Correctness, Latency, and Cost in Massive-Scale, Unbounded, Out-of-Order Data Processing. Proceedings of the VLDB Endowment, 8(12), pp. 1792-1803. Available at: https://www.vldb.org/pvldb/vol8/p1792-Akidau.pdf [Accessed 8 October 2026].
Apache Iceberg, n.d.a. Apache Iceberg™: The open table format for analytic datasets. Apache Software Foundation. Available at: https://iceberg.apache.org/ [Accessed 8 October 2026].
Apache Iceberg, n.d.b. Branching and Tagging. Apache Iceberg documentation. Available at: https://iceberg.apache.org/docs/latest/branching/ [Accessed 8 October 2026].
Apache Iceberg, n.d.c. Maintenance. Apache Iceberg documentation. Available at: https://iceberg.apache.org/docs/latest/maintenance/ [Accessed 8 October 2026].
Apache Iceberg, n.d.d. Spark Writes. Apache Iceberg documentation. Available at: https://iceberg.apache.org/docs/latest/spark-writes/ [Accessed 8 October 2026].
chrono-tz contributors, 2025. chrono_tz (version 0.10.4). docs.rs. Available at: https://docs.rs/chrono-tz/latest/chrono_tz/ [Accessed 8 October 2026].
Databricks, 2026. What is the medallion lakehouse architecture? Databricks documentation. Available at: https://docs.databricks.com/aws/en/lakehouse/medallion [Accessed 8 October 2026].
Google Cloud, n.d.a. Apache Iceberg managed tables. BigQuery documentation. Available at: https://docs.cloud.google.com/bigquery/docs/biglake-iceberg-tables-in-bigquery [Accessed 8 October 2026].
Google Cloud, n.d.b. Data retention with time travel and fail-safe. BigQuery documentation. Available at: https://docs.cloud.google.com/bigquery/docs/time-travel [Accessed 8 October 2026].
Google Cloud, n.d.c. Introduction to table snapshots. BigQuery documentation. Available at: https://docs.cloud.google.com/bigquery/docs/table-snapshots-intro [Accessed 8 October 2026].
Google Cloud, n.d.d. What is medallion architecture? Google Cloud. Available at: https://cloud.google.com/discover/what-is-medallion-architecture [Accessed 8 October 2026].
IANA, 2026. Time Zone Database Releases. Internet Assigned Numbers Authority. Available at: https://www.iana.org/time-zones/releases [Accessed 8 October 2026].
IANA, n.d. Time Zones. Internet Assigned Numbers Authority. Available at: https://www.iana.org/time-zones [Accessed 8 October 2026].
Python Software Foundation, 2026. zoneinfo: IANA time zone support. Python 3 documentation. Available at: https://docs.python.org/3/library/zoneinfo.html [Accessed 8 October 2026].